

Giving PR a chance: 2024 General Election
Part 3: What would the 2024 General Election have looked like under STV?

This is the third in a three part series detailing how British elections would look under Single Transferable Vote (STV) rather than the current majoritarian system. Part 1 set out the case for STV, while Part 2 covered how the 2015, 2017 and 2019 elections would have looked under that system. Part 3 provides an update with how the 2024 General Election would have panned out under STV.
The approach to modelling the 2024 election results under STV is essentially the same as that taken in the previous elections covered in Part 2: ‘first preference’ votes for each party in a constituency are summed, quota is calculated and then likely seats for each party assigned based on first preference votes and available pools of potential transfer votes.
The most significant difference since Part 2 is that between the 2019 and 2024 General Elections, we had significant boundary changes to the UK’s constituencies. This necessitated a redrawing of the boundaries of my own larger, multi-member ‘STV constituencies’. This will have affected results in individual constituencies in marginal cases, however as with most PR systems, this will have averaged themselves out across the country, so the overall result under the old boundaries is unlikely to have been significantly different. All other caveats and limitations from Part 2 also still stand.
The results: Labour
With the set-up out of the way, how would the 2024 General Election have looked if it had been conducted under PR? As shown below, Labour’s ruthlessly efficient vote distribution that saw them win almost 2/3 seats off 1/3 of votes cast under FPTP would have left them well short of a majority under STV at 288 seats (an increase of 50 on what their 2019 result would have delivered under STV).
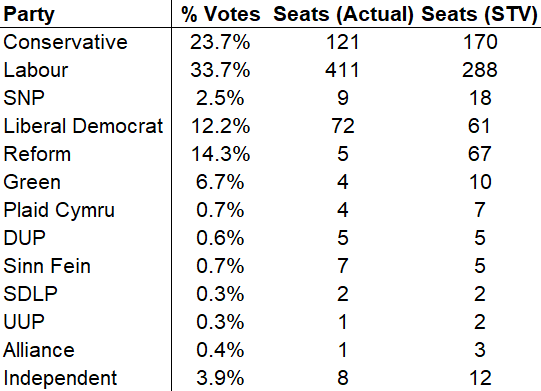
Note that this is still 44% of seats, meaning that their vote would still be sufficiently ‘efficient’ under STV to deliver them an outsized representation in Parliament, just not quite as outsized as under FPTP. As the constituency-level results show, Labour are able to win 44% of seats on 34% of the vote even under STV by virtue of being the leading ‘progressive’ and/or anti-Tory party in the vast majority of constituencies, meaning that transfers flowing from the Greens/Liberal Democrats etc. were often enough to get Labour candidates over the line on a relative low share of First Preference Votes.
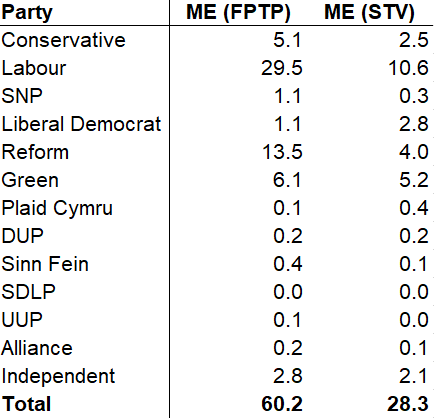
As shown below, the 2024 Election had an extraordinarily high ‘misrepresentation’ error of 60.2, even higher than the 47.8 recorded in 2015 - with Labour’s outsized majority being the primary driver. This falls substantially to 28.3 under STV, however this remains the largest in the STV elections I have reviewed, highlighting how STV only reduces misrepresentation and does not eliminate it entirely, meaning that election results that are more misrepresentative under FPTP will also be so under STV.
The results: Conservatives
The Conservative collapse, though still dramatic, would not have been quite so large, with the Tories being almost 50 seats better off under STV than they were in the actual result. This is a well-documented feature of electoral systems, where once parties enter the ‘Death Zone’ of the mid-20s and below, small shifts in vote numbers lead to large shifts in seats under a majoritarian system. In contrast, a PR system will often ‘cushion’ these falls (as we saw in Part 2 with the Liberal Democrats in 2015). It is important not to overstate this effect however - even under STV, the Conservatives still would have lost almost half of their MPs and would be only narrowly ahead of Reform in seat-terms across the North of England.
The results: Liberal Democrats
Although the Liberal Democrat result under STV is broadly in line with what they actually received, in terms of actual power, it would have been vastly different. Whereas the actual 2024 election left the Liberal Democrats with the somewhat uncertain role of large third party in a Parliament where the government majority is over 170, under STV they would have become the king-makers, likely propping up a Labour-led government and therefore having significantly more influence over policy.
The results: Reform
As with UKIP in 2015, Reform would be the largest winners under STV in 2024, increasing their seat count from 5 to 67 and overtaking the Liberal Democrats as the 3rd largest party. Also as in 2015, Reform’s seat-count under STV would still be lower than its % of votes received. This is largely down to a lack of potential transfers compared to other competitor parties, particularly with the decline in the Tory vote. When looking at results regionally compared to UKIP’s 2015 performance, Reform increased its seat totals in the Midlands, North1 and East of England (dramatically).
In contrast, Reform performed comparatively less well in the South East and South West. Its relatively poor showing compared to UKIP in the South West is particularly striking (2 seats vs 4 in 2015) and could the result of:
i) Reform-minded voters sticking with the Conservatives in order to vote tactically and keep out the Liberal Democrats (less of a concern where the Tories are not going to win the seat regardless).
ii) The ‘Sunak effect’/Blue Wall-targeted Tory campaign paying dividends in terms of holding their voter coalition together more effectively in the South than elsewhere.
iii) A certain degree of anti-Tory tactical voting amongst Reform-minded voters for the Liberal Democrats. Remember that the Lib Dems are not viewed as a ‘party of the left’ by significant sections of the population and will have hoovered up the ‘plague on both your houses’ vote in the South that may have gone to Reform elsewhere (note that in 2015 the Lib Dems could not play this role).
iv) Demographic change: In 2015 UKIP won 29% of the vote across the North and South Thanet seats. In 2024 Reform won just 21% in the closest equivalent seats, despite a higher vote nationally. Part of this will of course be down to Farage standing there in 2015, but another factor will have been the well-documented trend of young Londoners moving to towns such as Margate to escape unaffordable housing costs in the capital. These voters have broadly taken their politics with them and this contributes to the Reform vote being somewhat less southern than UKIP’s was in 2015.
The results: Green Party
The 2024 election was good for the Greens, but it would have been even better under STV with the party winning 10 seats including winning multiple seats in a single constituency for the first time2. The Greens’ 10% of the vote in London also would have been enough for 3 seats under STV in the capital (in The East End, Lewisham and Greenwich and Hackney and Islington)3. The party generally performed well in the centre of large cities and likely would have also won seats in Manchester and Glasgow. Note that under STV, the Green party’s constituency base would be much more ideologically coherent than it has ended up being under FPTP.
The results: Independents
Alongside the growth of the Greens, the ‘Gaza Independents’ were the other challenge to Labour’s core vote in 2024, winning 5 seats (4 in heavily Muslim constituencies + Jeremy Corbyn in Islington North). Under STV, Corbyn would again have been returned in North London but would have been accompanied by 9 other ‘Gaza Independents’. In several areas (e.g. Birmingham, East and North East London, Lancashire) the Gaza Independent vote was large but came up short under FPTP across multiple neighbouring constituencies. With STV, several of these candidates would have been returned once those constituencies are accounted together.
(As an aside - if current polling trends continue, Birmingham Hodge Hill and Solihull North is on track to be a Gaza/Reform marginal in 2029, if raw sectarian headcounts are your thing.)
The results: Scotland
As with the Tories, the SNP entering the ‘Death Zone’ in 2024 would not have been as catastrophic in seat-terms under STV, winning 18 rather than the 9 they actually ended up with and Labour’s total being restricted to 24 rather than 37. Tory decline and Liberal Democrat gains seen elsewhere were also repeated in Scotland.
Reform’s 7% of the vote in Scotland was however a surprise that went somewhat unremarked upon on election night but could have significant consequences moving forward, vastly above the 1.6% UKIP scored there in 2015. This performance was sufficient for the party to displace the Tories as the lead party of the right in parts of the Central Belt, potentially delivering them an MP in the ‘Lanarkshire’ seat (though this is marginal).
The results: Wales
Labour winning 84% of Welsh seats on 38% of the vote obviously does not translate under an STV election. Instead they likely would have won 14 (down 7 on what they would have won in 2019 under STV), with the Tories winning 6 and Reform 5.
Plaid Cymru would have been the big winners under STV with 7 seats, not only higher than the 4 they actually won but also a dramatic increase on the 2 they likely would have won under STV in 2019. Plaid’s ability to win more seats under STV than their vote share implies in 2024 was largely down to a couple of larger seats in South Wales pulling their candidates into contention there and being able to draw on a relatively large pool of friendly transfers from the Greens. However, several of these seats are quite precarious and would be very vulnerable in 2029 to any Labour/Tory recovery or Reform improvement.
The results: Northern Ireland
I have the DUP and Sinn Fein on 5 seats each under STV in 2024, with Alliance on 3 and the SDLP and UUP winning two each. The final seat likely would have been a non-DUP/UUP unionist seat in the Armagh and Down constituency. I currently have it listed as an Independent (i.e. Alex Easton), however this is hard to call given we have no idea how he would poll outside of North Down. Similarly, on the actual numbers alone, I have Jim Allister missing out in the Antrim seat, but there is little doubt TUV numbers in South and East Antrim would have been much stronger were he on the ballot in those areas.
The long-run view
Wrapping up with how the last decade in UK politics would have looked had elections been conducted under STV. One immediately noticeable trend is that for all of Labour’s drama since 2015, their seat count under STV (+ their vote share) has been remarkably consistent at between 200 and 300. Viewed positively, this could be a sign of the resilience of Labour’s vote, whereas viewed negatively it could be an indication of their inability to broaden their appeal. It also highlights just how precarious Labour’s current total of 400+ seats is - not only is this a departure from what we could expect their historic vote totals to deliver, if they do enter the ‘Death Zone’ in 2029 (as current polling suggests), then the falls in seat numbers could exceed even those experienced by the Tories this year.
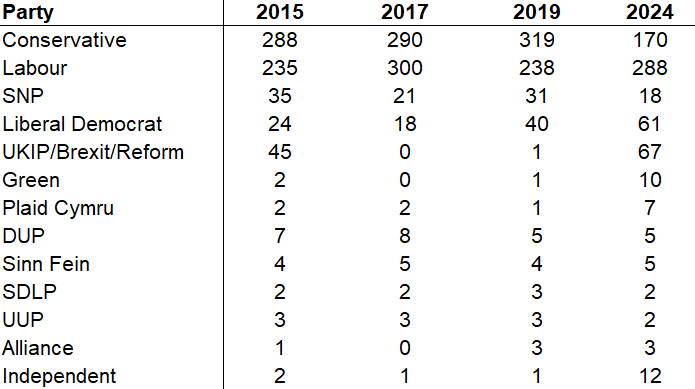
For the Tories, this longer term view highlights just how dependent their performance has ended up being on the presence and strength of Nigel Farage over the last 10 years and how difficult it will be for them to get back to anything resembling their 2019 position while Reform retain their appeal.
Except Yorkshire and the Humber, although their decision not to stand in any of the Sheffield seats likely cost them at least 1 seat under STV.
They would have won 2 seats in a 6-seater Bristol constituency.
The demographic shifts outside of London mentioned with Reform above would also benefit the Greens. They would have scored 0.64 of a quota in an ‘East Kent’ 6-seater constituency. Not enough for a seat but enough to outpoll the Lib Dems almost 2:1.